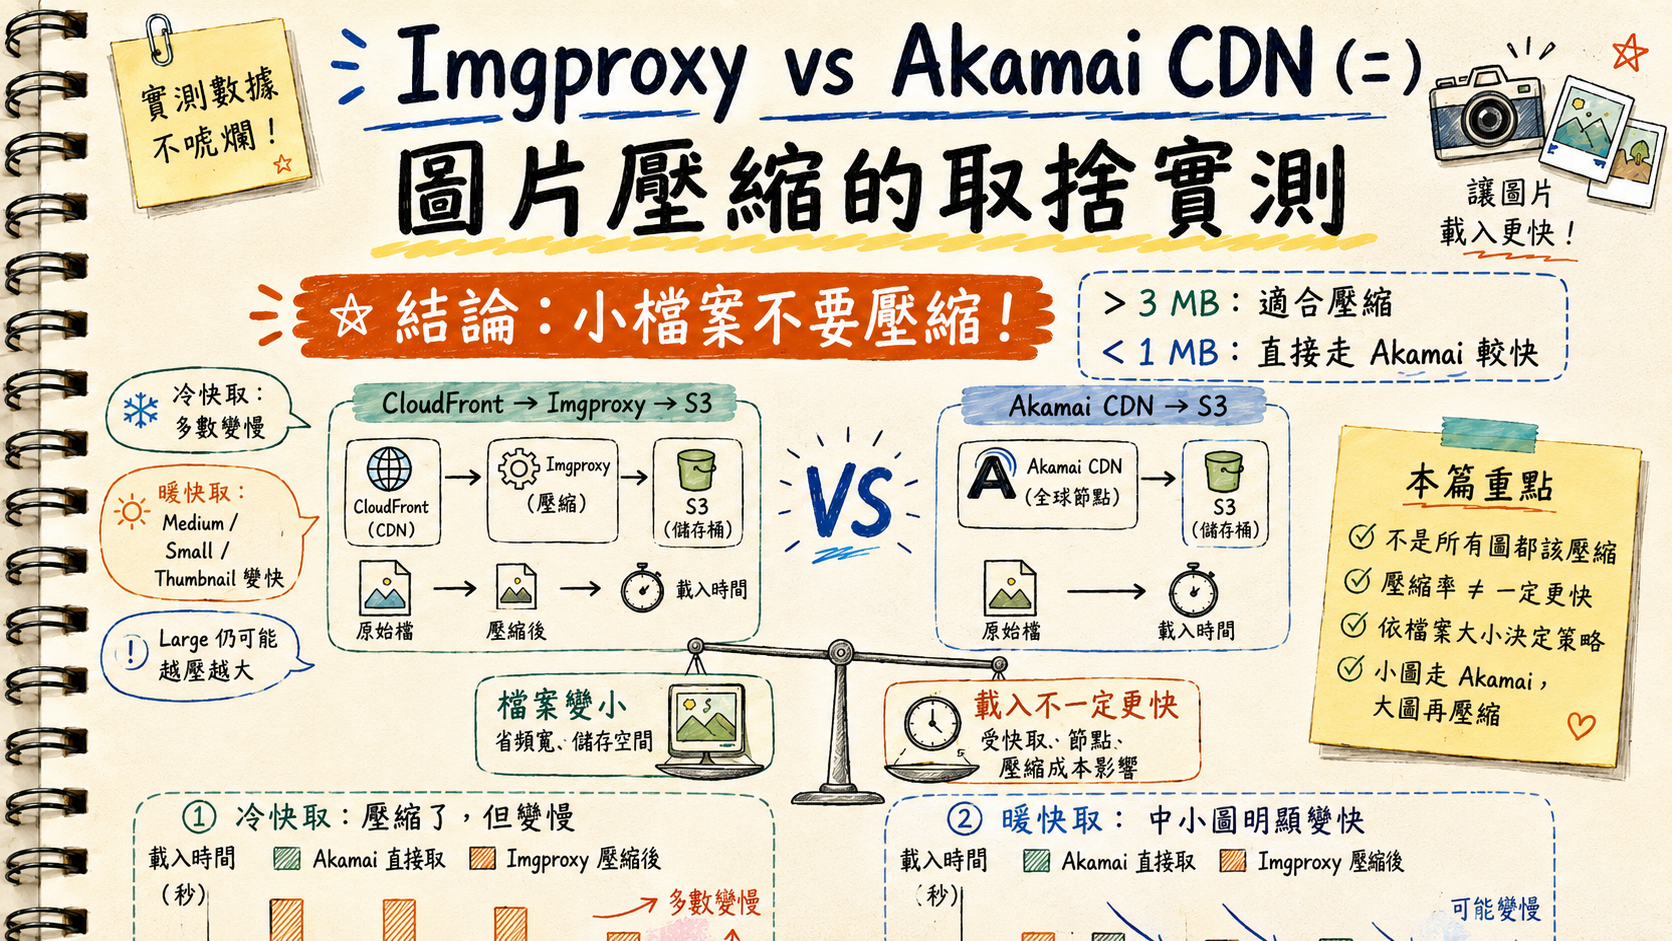
TL;DR
- Compression isn’t free. With a cold CDN cache, every Imgproxy rule made total load time worse — between −113% and −154%.
- Warm cache flips three of four tiers. Medium, Small, and Thumbnail finally beat the Akamai path. Large still ends up bigger than the original.
- Pearson r between compression ratio and time-savings drops as files shrink — 0.78 → 0.47 from Large to Thumbnail. Large-tier compression is the most predictable, but its actual gain is the worst.
- Single action rule that fell out of the data:
if original_size > 3 MB → route to Imgproxy; else → serve origin directly via Akamai.Cuts the long tail of compression-induced regressions without giving up the wins on large files.
If you operate a CDN + dynamic-image-pipeline stack and you’ve ever assumed “compress everything, it’s safer” — this is the data that pushed us off that default.
Background
Part 1 of this series established that once the CloudFront cache is warm, CloudFront → Imgproxy → S3 is comparable to Akamai → S3 on raw download speed.
But raw download speed isn’t the point. Imgproxy exists to compress images so the user gets a smaller file faster. The question this post answers is the obvious follow-up:
Does compressing actually make pages load faster — and if so, for which files?
I treated this as an experiment, not an opinion: design a compression policy, run it against real S3 traffic, log timings, and let the numbers decide.
Goals
- Produce compressed outputs at 50 KB, 250 KB, 500 KB, and 1 MB tiers.
- Skip compression for any file already below a tier’s target — never let the policy make files bigger.
- Support PNG, JPG, AVIF, WEBP — pick the right format per source.
- Emit multiple resolutions so the frontend can pick by network conditions.
Compression design
Step 1: Inspect file size and format
- Pull the original from
Akamai → S3, then check size and format. - If the file is already smaller than a tier’s target (e.g. trying to hit 250 KB on a 70 KB file), skip that tier and move to a tighter one (50 KB).
- Otherwise, compress or transcode.
Step 2: Pick a format strategy
Priority:
- JPG (JPEG) — best for photos and rich color; lossy but compresses hard.
- AVIF / WEBP — even higher compression, near-lossless; ideal for modern browsers.
- PNG — keep when transparency matters; lossless but weak compression.
Routing:
- PNG → JPG: opaque PNG that’s too large — flip to JPG.
- AVIF → AVIF: already small; just adjust quality.
- JPG → JPG: drop quality.
- GIF → WEBP: 30–50% smaller on animated content.
Step 3: Compression parameters
Rules of thumb:
- JPG:
quality=70-80is the sweet spot;70still looks fine and ships substantially less data. - PNG: lossless, or transcode to JPG when transparency doesn’t matter.
- WEBP / AVIF:
quality=60-70keeps quality high while files stay tiny.
The parameter table we landed on:
PNG
| Original size | Parameters |
|---|---|
| > 1 MB | q:80/rs:fit:1920:1080 |
| 500 KB – 1 MB | q:70/rs:fit:1280:720 |
| 250 KB – 500 KB | q:60/rs:fit:800:600 |
| 50 KB – 250 KB | q:50/rs:fit:400:300 |
JPEG / JPG
| Original size | Parameters |
|---|---|
| > 1 MB | q:80/mb:1000000/rs:fit:1920:1080 |
| 500 KB – 1 MB | q:70/mb:500000/rs:fit:1280:720 |
| 250 KB – 500 KB | q:60/mb:250000/rs:fit:800:600 |
| 50 KB – 250 KB | q:50/mb:25000/rs:fit:400:300 |
WEBP
- Baseline:
q:80,mb:250000. - Tier adjustments mirror JPEG.
Step 4: Multi-version output
Each source image fans out into:
original(untouched)large(1 MB)medium(500 KB)small(250 KB)thumbnail(50 KB)
Each variant lives at a distinct S3 path so the frontend can pick.
Execution
1. Audit S3
Pulled every user_upload from the staging bucket and counted formats.
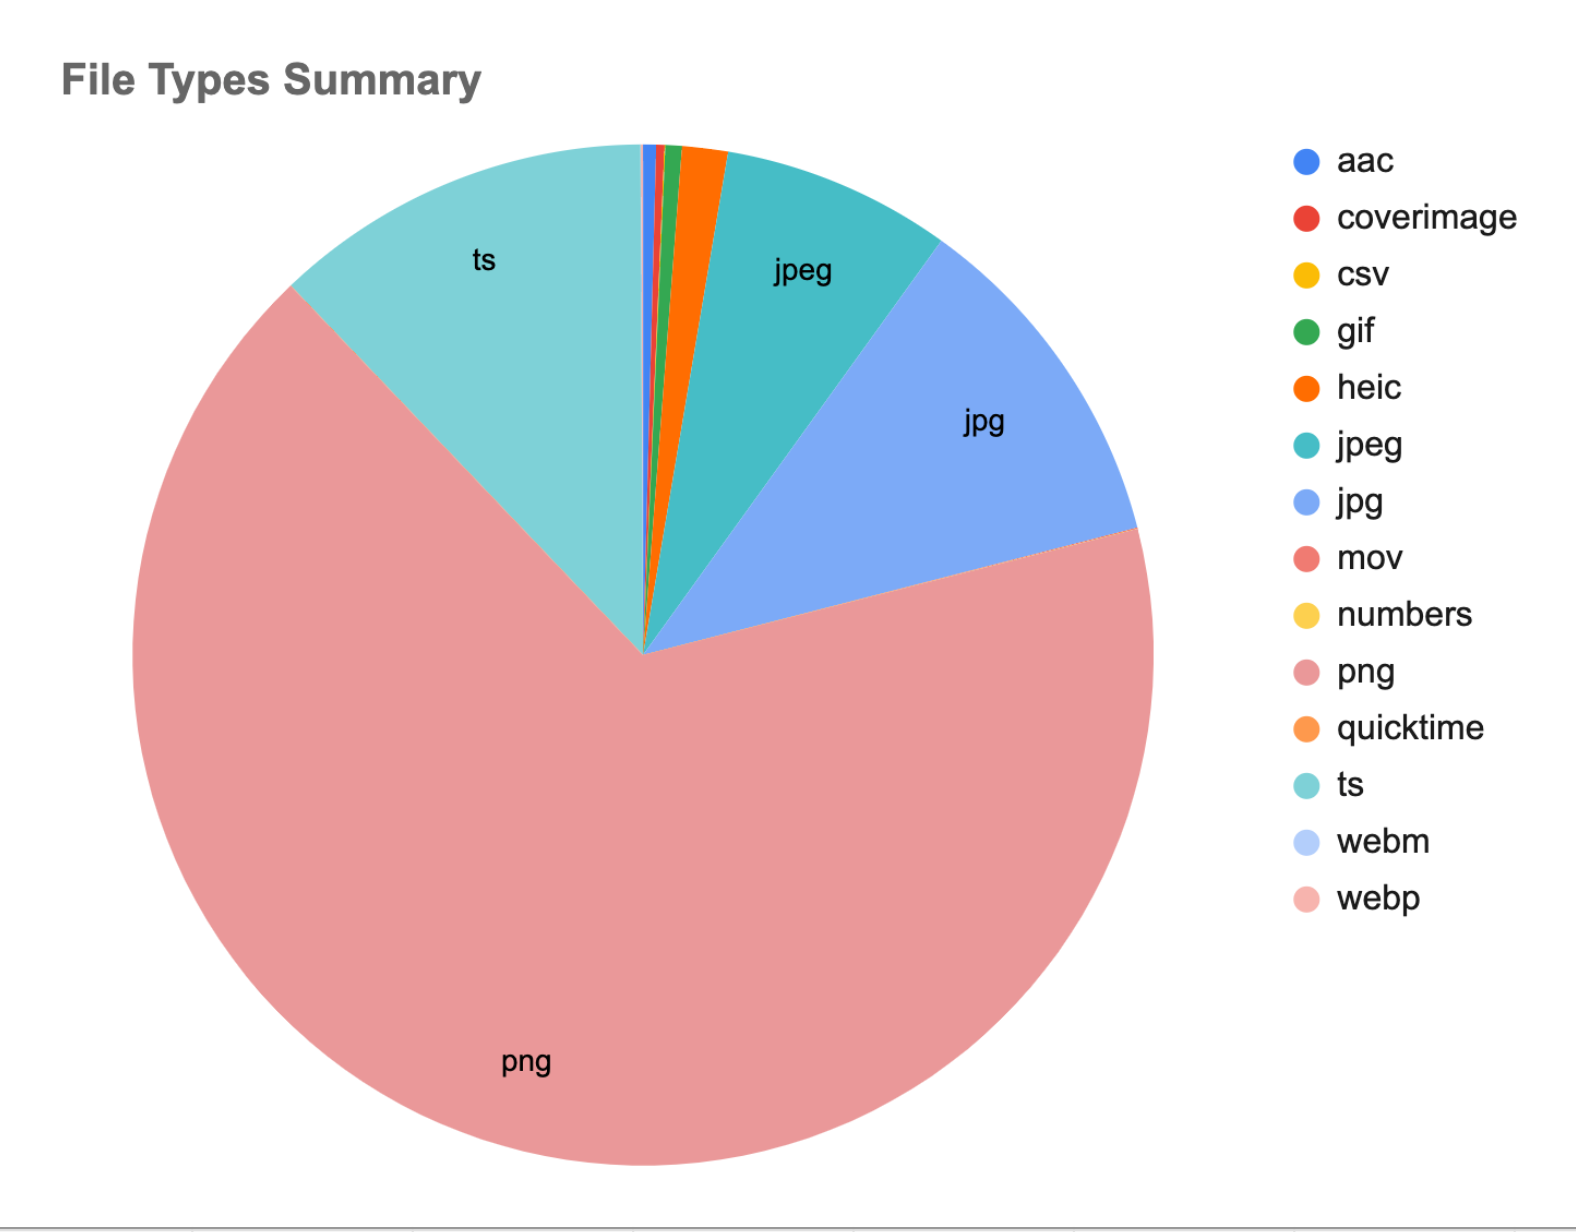
Fig 1. File types in the S3 user_upload bucket
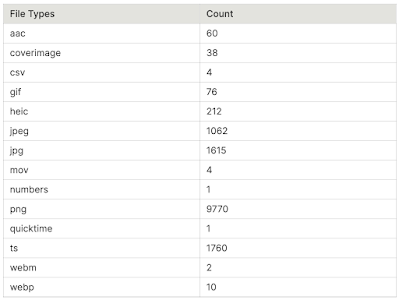
Table 1. Counts by file type
2. Align with frontend
All uploads are normalized to .png upstream — so the dataset skews PNG.
3. Apply the size guard
Files only hit Imgproxy if their original size exceeds the tier target. Otherwise: skip.
- PNG 241 KB → skip
> 1 MBand500 KB – 1 MB. - JPEG 13 MB → all four tiers run.
- WEBP 80 KB → only
50 KB – 250 KB.
4. Metrics
For every file, against every rule:
cdn_s3size and time.- Per-rule
cdn_imgproxysize and time (blank if skipped). - Download each variant 3× and average.
- Compute compression ratio:
cdn_s3vs each rule. - Compute time reduction:
cdn_s3vs each rule.
5. Two runs
Two passes total. The first deliberately starts cold so the CDN cache hasn’t warmed up; the second runs on the same dataset after caches are populated.
Experiment 1 — cold cache
Fig 2 shows the first-pass data across all four compression tiers.
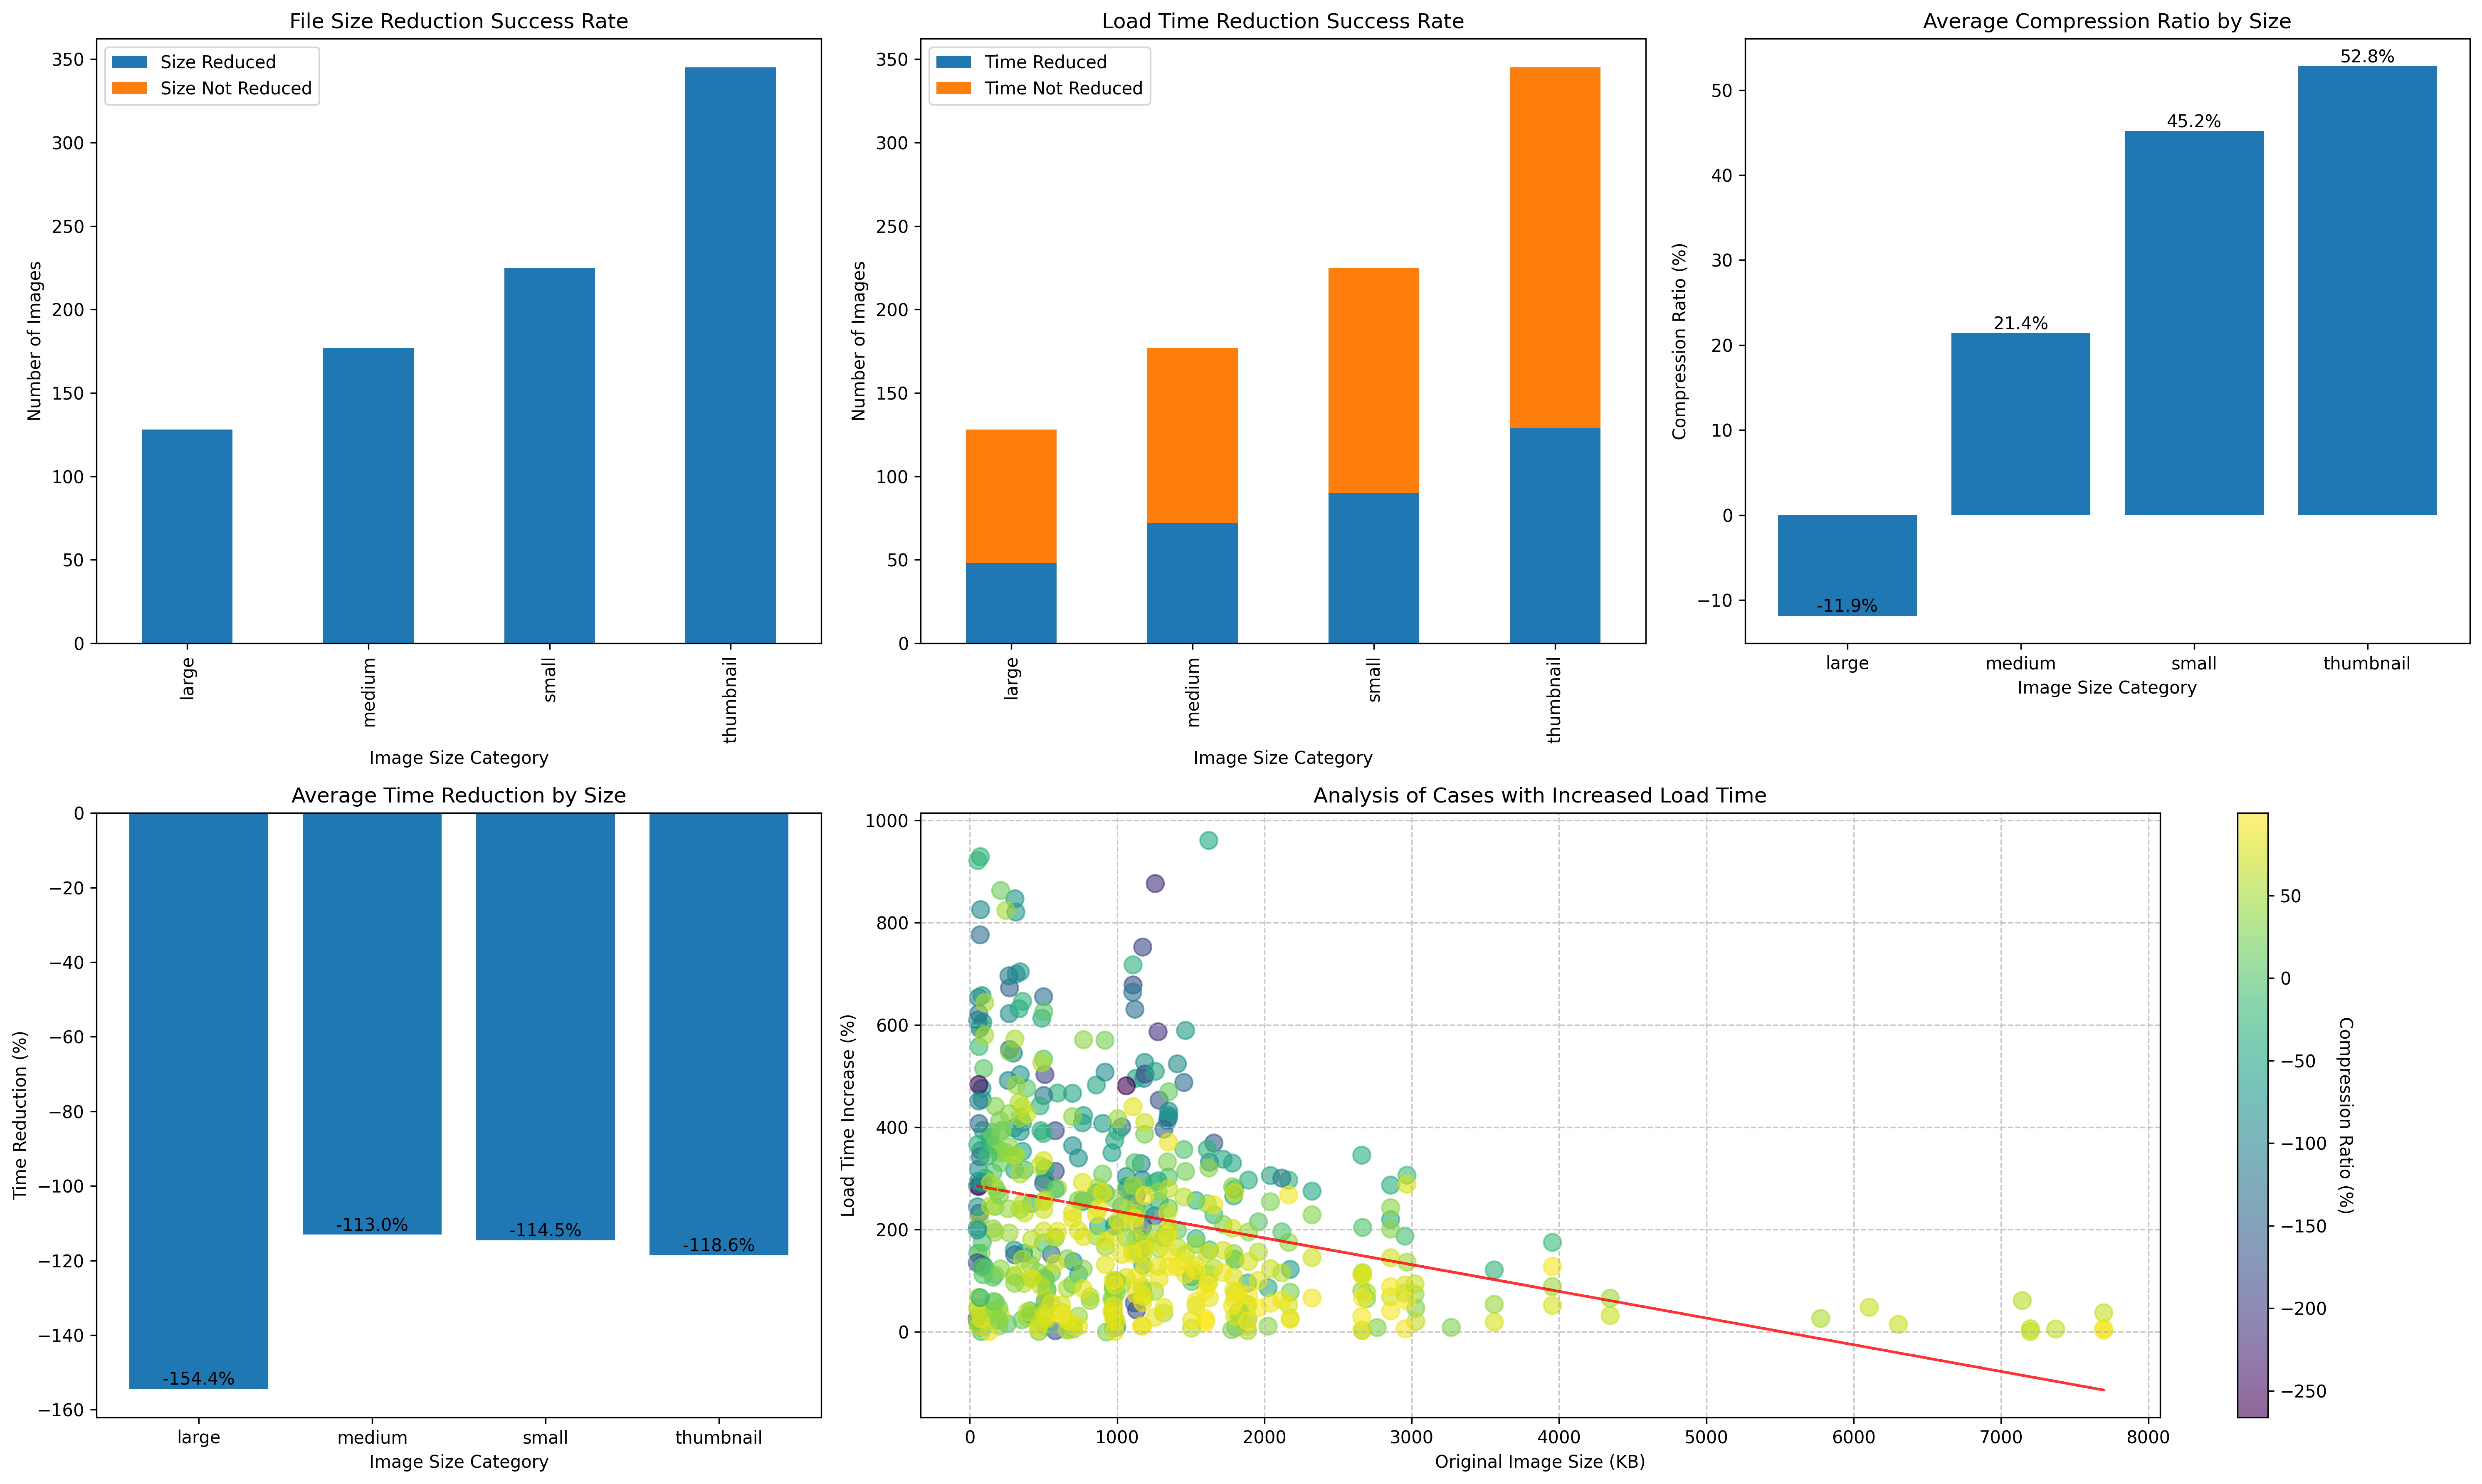
Fig 2. First-run dashboard — compression counts (top-left), files that loaded faster (top-middle), compression-ratio distribution (top-right), time-reduction rate (bottom-left), regression cases (bottom-right)
Compression counts (top-left)
All four tiers compressed successfully — no negative-ratio outliers. Large matched the fewest files (only the largest originals qualify); Thumbnail matched the most.
Files that loaded faster (top-middle)
Every tier sat below 50% — meaning fewer than half the compressed files actually loaded faster than the Akamai path.
Compression ratios (top-right)
Large’s distribution drifts into the negative — some files come out bigger after the Large rule. The other tiers hit clean positive ratios.
Time reduction (bottom-left) — the counterintuitive result
| Rule | Time reduction | Equivalent to |
|---|---|---|
| Large | -154.4% | ~2.5× slower |
| Medium | -113.0% | ~2.1× slower |
| Small | -114.5% | ~2.1× slower |
| Thumbnail | -118.6% | ~2.2× slower |
Definition:
time_reduction = (results['cdn_s3_time'] - avg_time) / results['cdn_s3_time'] * 100
That is, (S3 mean time − Imgproxy variant mean time) / S3 mean time × 100.
Read: the Imgproxy processing overhead more than wiped out the file-size savings. Smaller files arrived slower.
Plausible drivers:
- Imgproxy adds CPU time per request.
- CDN cache miss penalty on first request.
- The
cdn_s3originals were already warm in the CDN. - Imgproxy server location / capacity bottleneck.
Regression-case scatter (bottom-right)
Drilling into the cases where compression made things worse:
- X: original file size (KB).
- Y: load-time increase (%).
- Color: compression ratio (yellow → green → purple, high → low).
Pattern:
- Trend line slopes downward (red).
- The cluster sits between 0 and 3 MB.
- Load-time penalty stretches 0–600%.
Finding:
- Smaller originals (< 2 MB) see the biggest penalty — up to ~900%.
- Larger originals see smaller penalties, sometimes wins.
Operational read:
- Compressing small files is worse than not compressing.
- Large files benefit more reliably.
- Route by original size, not by category label.
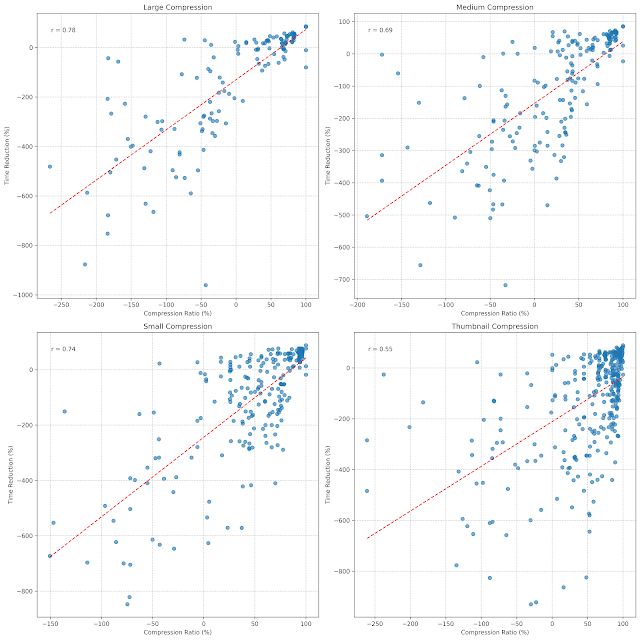
Fig 3. Cold cache — Pearson r per tier
Per-tier correlation
| Tier | r | Read |
|---|---|---|
| Large | 0.78 | Strongest positive correlation — more compression, more time saved |
| Medium | 0.69 | Next strongest; more scatter |
| Small | 0.74 | Tight cluster |
| Thumbnail | 0.55 | Weakest — high variance |
Summary of Run 1
Akamai → S3 beats CloudFront → Imgproxy across every tier on total load time. The time-reduction panel in Fig 2 says it best: every bar sits in the negative.
Hypothesis for Run 2: the CDN cache hadn’t been built yet. Let’s run again with the cache warmed.
Experiment 2 — warm cache
Purpose
Does Imgproxy compression + warm CDN cache actually beat the origin path?
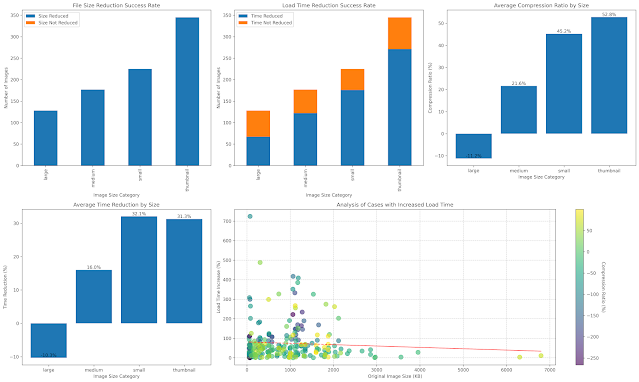
Fig 4. Second-run dashboard — warm-cache results
Differences from Run 1
- Regression count (orange in top-middle) dropped substantially.
- Large still produces bigger-than-original files — parameters need tightening, or Akamai’s built-in compression on large images is just very good (see Appendix).
- Time reduction (bottom-left): Medium, Small, and Thumbnail flipped from negative to positive — they now genuinely save time. Large stayed negative.
Regression-case scatter (bottom-right)
- Small files (< 1000 KB) still show the biggest swings — some penalties up to 700%.
- Large files (> 3000 KB) regress less — usually under 50%.
Conclusion:
- > 3 MB files: route through Imgproxy.
- < 1 MB files: serve original via Akamai → S3.
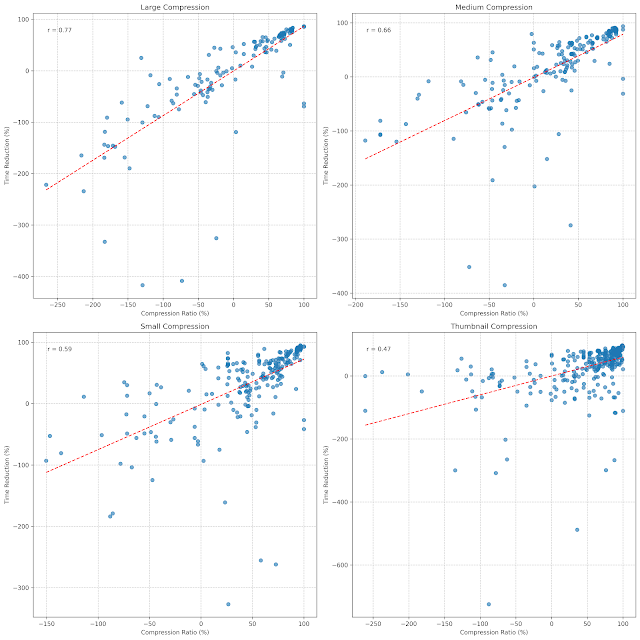
Fig 5. Warm cache — Pearson r per tier
Correlation analysis
Pearson r decays as we move to smaller tiers (0.77 → 0.47). All tiers remain positive — higher compression usually delivers larger time savings — but the relationship grows noisier the smaller the file.
- Large is the most predictable (highest r).
- Thumbnail underperforms Akamai’s pipeline by enough margin that the win, when it happens, isn’t worth the variance.
Negative regions on these charts mean:
- Negative ratio: the file grew.
- Negative time reduction: load time got worse.
Operational recommendations
- When you need predictable performance gains, prefer Large.
- Thumbnail’s high compression doesn’t translate to a reliable speedup over Akamai.
- Large parameters still need tuning to eliminate the “compressed but bigger” cases.
Summary
- Not every file should be compressed. Files under 1 MB are faster through
Akamai → S3directly. - Cold cache: Imgproxy loses outright. Every tier sat at −113% to −154%.
- Warm cache: only Medium / Small / Thumbnail benefit. Large still grows files.
- Compression ratio correlates with time savings (r 0.77 → 0.47). Large is most predictable; Thumbnail noisiest.
- Action rule: in the Imgproxy gateway, add
if original_size > 3 MB → compress; else → origin. This was the smallest change with the largest effect on the long tail of regressions.
The bigger lesson for any image pipeline I touch from here on: measure round-trip time, not file-size deltas. Compression is a means, not the goal.
Appendix
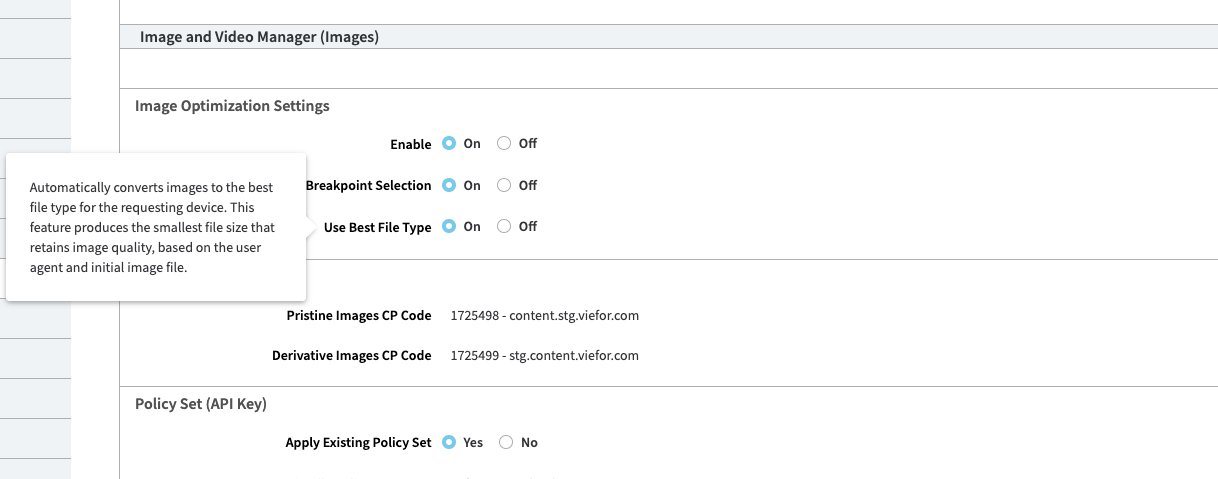
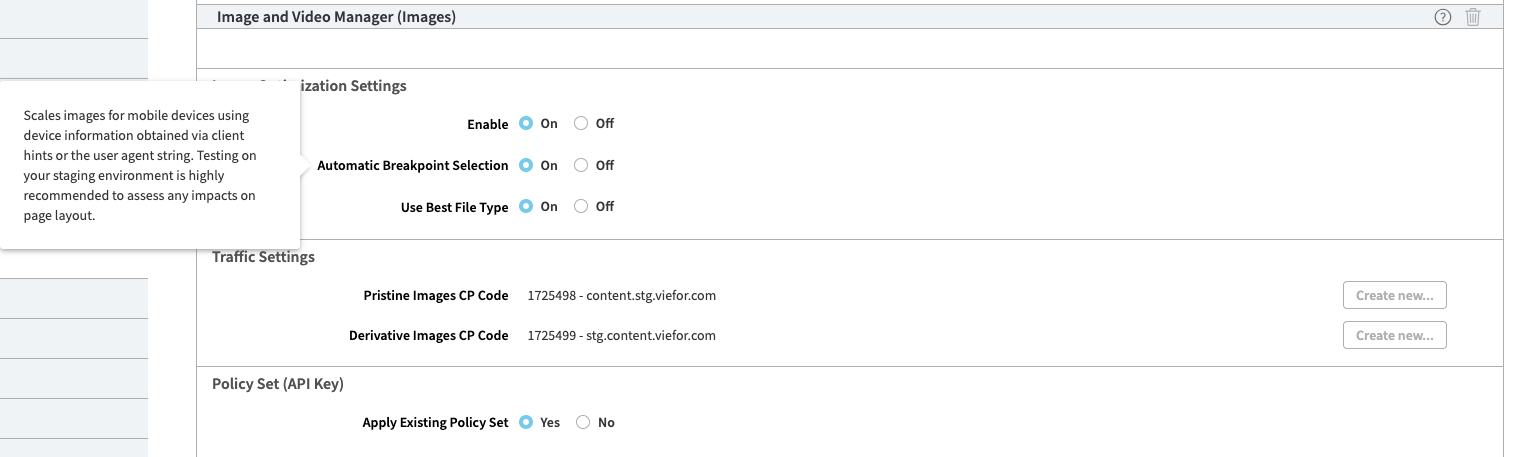
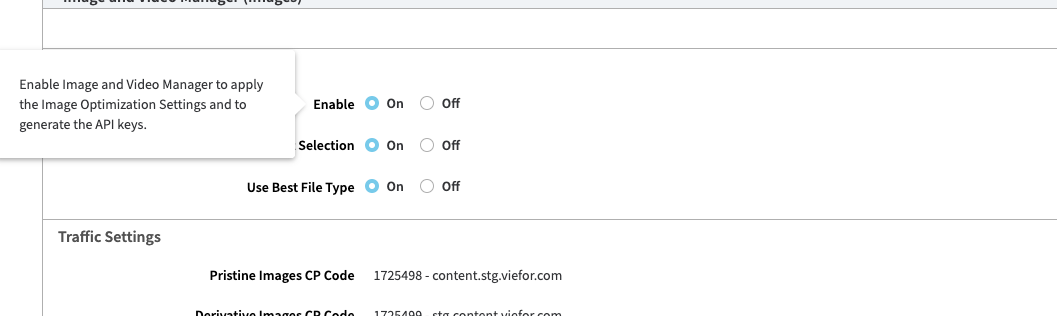
1. Akamai settings
We had Akamai’s automatic compression already running on large images — almost certainly part of why the Large tier in Imgproxy can’t beat it head-to-head. For full reproducibility, the relevant Akamai configuration screens:
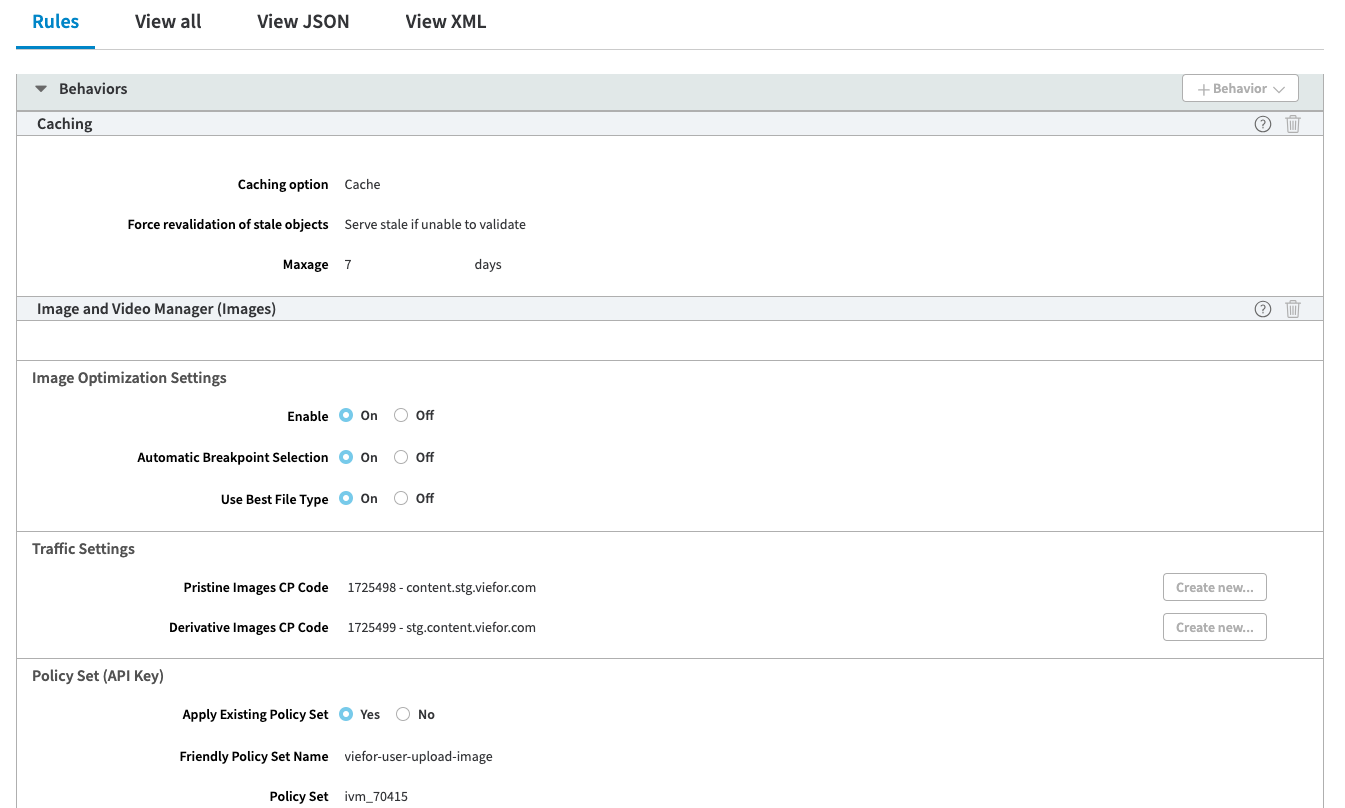
Akamai settings — 1
Akamai settings — 2
Akamai settings — 3
Akamai settings — 4
This post is also available on Medium (cross-posted, link forthcoming).