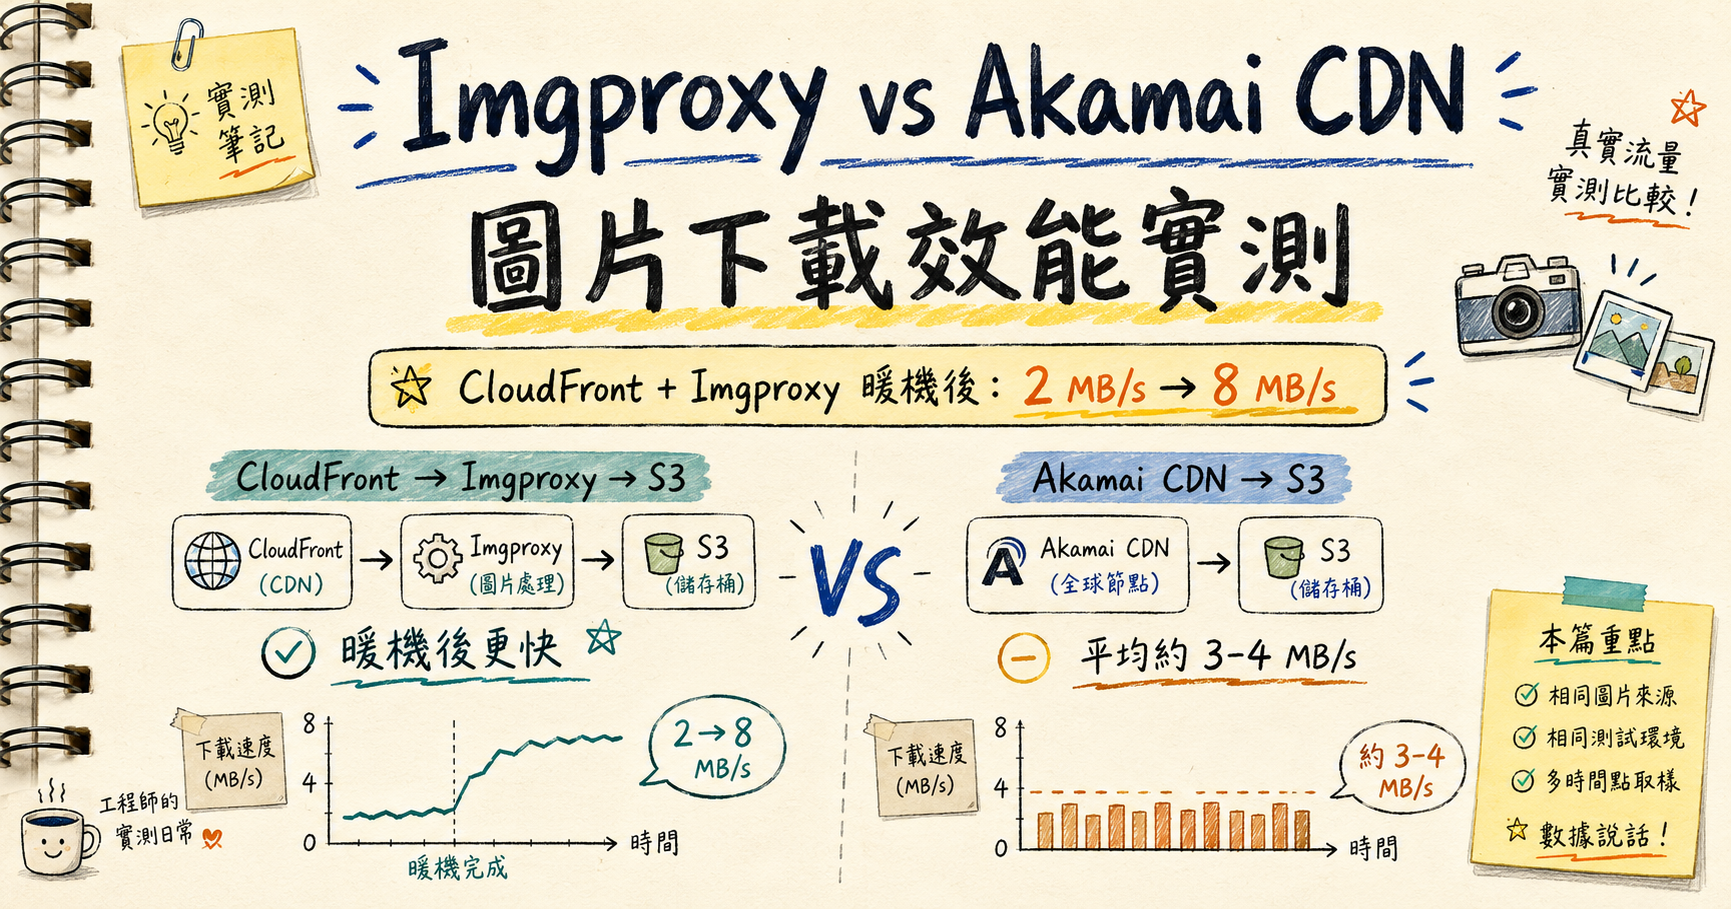
TL;DR
- I put Imgproxy behind AWS to compress images on the fly. Without a CDN in front of it, throughput tops out at about ~2 MB/s (max 2.65 MB/s), versus ~10 MB/s from Akamai → S3.
- Adding CloudFront in front of Imgproxy fixes this — but only after the cache is warm. The first request per object still hits Imgproxy’s ~2 MB/s ceiling.
- Verified with a Wilcoxon signed-rank test (non-parametric, paired): speed1 vs speed3 gives W = 38.0, p ≈ 3.09 × 10⁻⁸³. The warm-up effect is real, not measurement noise.
- Per-request medians: 1st download ≈ 0.5–1.0 MB/s, 2nd ≈ 4.0–4.5 MB/s, 3rd ≈ 7.0–7.5 MB/s.
- Practical takeaway: if you front Imgproxy with a CDN, the first viewer of any asset pays the latency cost. Pre-warm the cache for hero / above-the-fold images, or accept that “cold” UX will look like there is no CDN at all.
Motivation
I shipped a social app. Images on the feed flash black for a second or two before they actually paint. Users scrolling fast see a wall of black squares. Bad.
The first-pass diagnosis: payload size. The hot fix on the table: compress images on delivery. The choice of compressor: Imgproxy, deployed behind an AWS Application Load Balancer and used as a transformation proxy in front of S3.
Origin: S3. CDN in front of S3: Akamai. New addition: Imgproxy on the path, optionally fronted by CloudFront.
The shape of the request path looks like this:
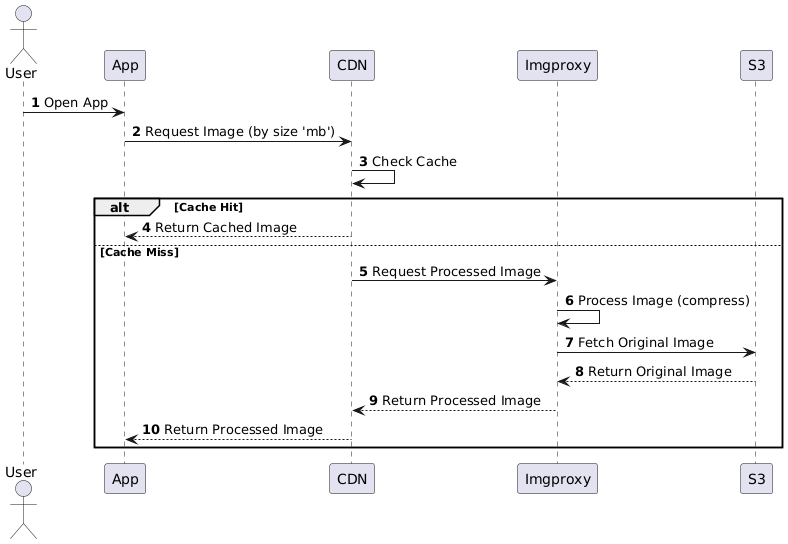
Figure 1. CDN → Imgproxy → S3 request path
Before I committed to this architecture in production, I wanted a real answer to a simple question: does Imgproxy itself bottleneck the pipeline? If Imgproxy has a hard throughput ceiling, no amount of compression downstream will save the first viewer of an asset.
Experiment Design
Hypothesis
Imgproxy compression will speed up image delivery end-to-end.
What I’m comparing
A grid of paired comparisons:
- S3 vs Imgproxy → S3
- Akamai → S3 vs Imgproxy → S3
- Akamai → S3 vs CloudFront → Imgproxy → S3
- CloudFront → Imgproxy → S3 with cold cache vs warm cache (1st vs 2nd vs 3rd request)
- Akamai → S3 vs warm CloudFront → Imgproxy → S3
Environment
- Client network: Starbucks Wi-Fi (yes, really — same network across all measurements, so this is a constant, not a confound).
- Origin: AWS S3.
- Imgproxy: AWS Application Load Balancer.
- CDN in front of S3: Akamai.
- CDN in front of Imgproxy: CloudFront.
A separate “CloudFront → S3 vs CloudFront → Imgproxy → S3” comparison is left for a follow-up.
Measurement protocol
For each pairwise test:
- Define a control configuration and a treatment configuration.
- Download the same file through both paths.
- Repeat 3 times back-to-back; compute mean throughput per configuration.
- Repeat across many files to get a sample, then plot the paired distribution.
Most test files were under 2.5 MB — representative of real social-feed images.
Test 1 — S3 direct vs Imgproxy → S3
Goal
Is there a throughput difference between fetching directly from S3 and fetching through Imgproxy?
Hypothesis
Putting Imgproxy in front of S3 will not meaningfully change download speed.
Method
- Control: S3
- Treatment: Imgproxy → S3
- Three downloads of the same file through each path, averaged.
Results
Imgproxy looks throttled at around 2 MB/s. S3 direct goes higher, but it has its own cliff: files under 2 MB hit up to 10.0 MB/s, while files over 2.5 MB drop into a regime under ~4 MB/s. So S3 is faster, but not unboundedly.
The speed difference distribution sits clearly on the positive side, meaning S3 wins basically every paired sample.
Conclusion: S3 > Imgproxy on raw throughput. S3 itself has size-dependent throttling around the 2.5 MB boundary, which matters because most of our images are under 2.5 MB.
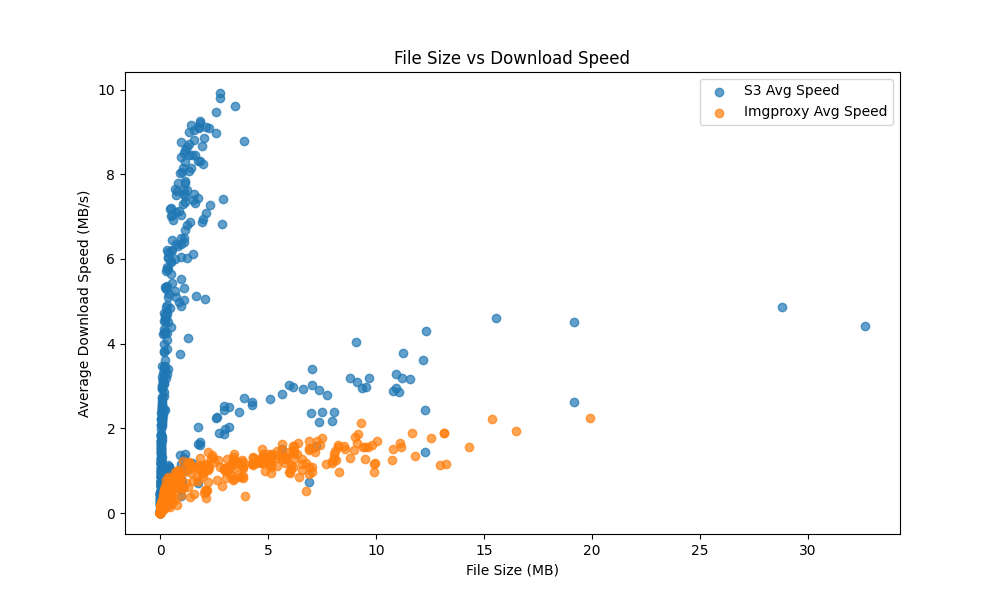
Figure 2. S3 vs Imgproxy → S3 download speed scatter
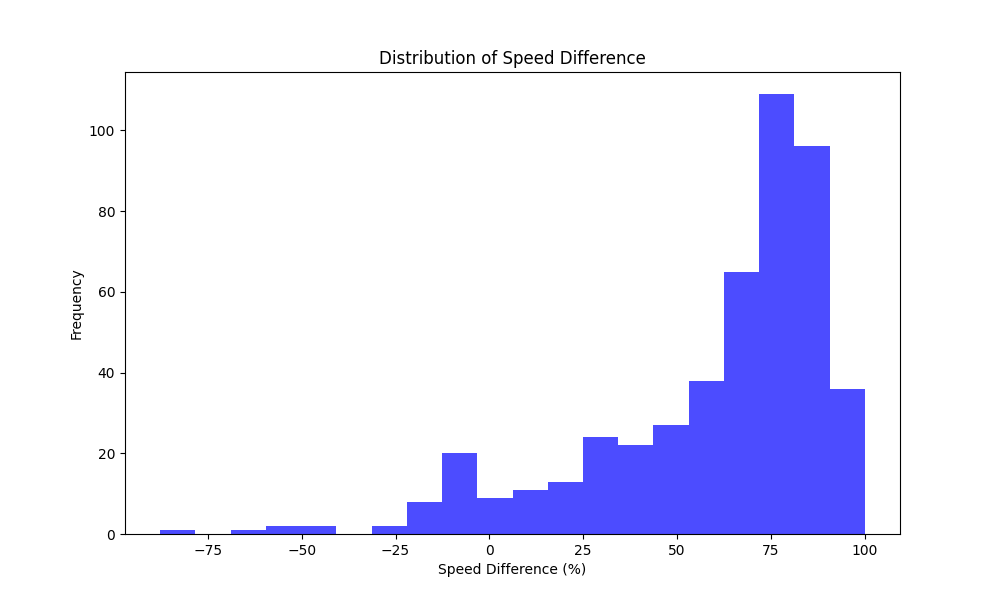
Figure 3. S3 vs Imgproxy → S3 speed difference histogram
How “speed difference” is calculated
speed_difference_percent = (
    (mean([r['speed_mbps'] for r in original_results])
     - mean([r['speed_mbps'] for r in imgproxy_results]))
    / mean([r['speed_mbps'] for r in original_results])
    * 100
)
A positive value means the control (S3) was faster. The histogram concentrates on the positive side — S3 wins.
Test 2 — Akamai → S3 vs Imgproxy → S3
Goal
How does Imgproxy compare against the existing Akamai-fronted S3 path?
Hypothesis
Both Akamai and Imgproxy have throughput ceilings, but at different levels.
Method
- Control: Akamai → S3
- Treatment: Imgproxy → S3 (no CDN in front of Imgproxy)
- Three downloads each, averaged.
Results
Standalone Imgproxy hits its now-familiar ceiling: ~2 MB/s, max 2.65 MB/s. Akamai → S3 goes up to 10.08 MB/s. The speed difference distribution is consistently positive — Akamai wins by a big margin.
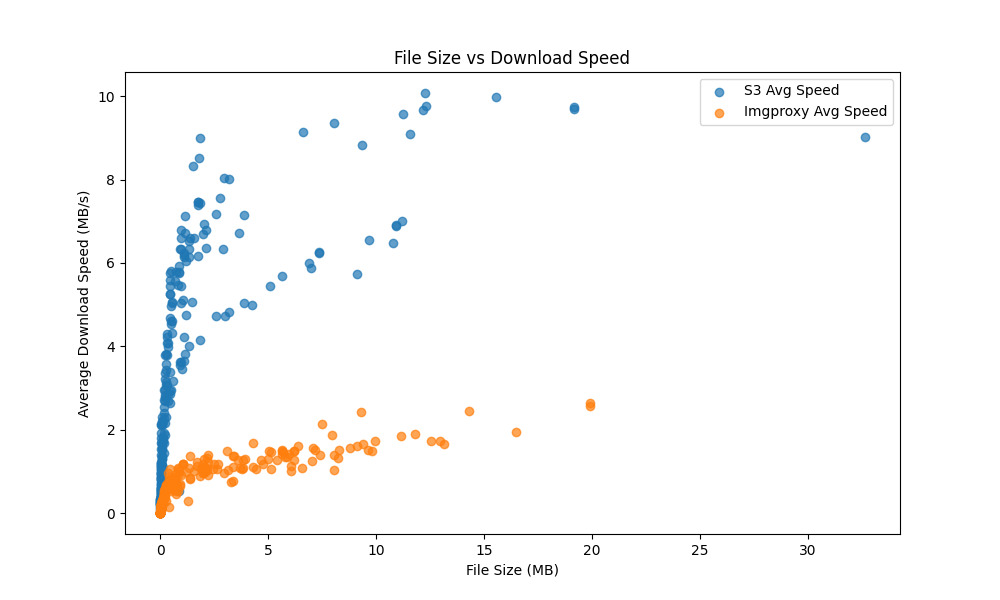
Figure 4. Akamai → S3 vs Imgproxy → S3 download speed scatter
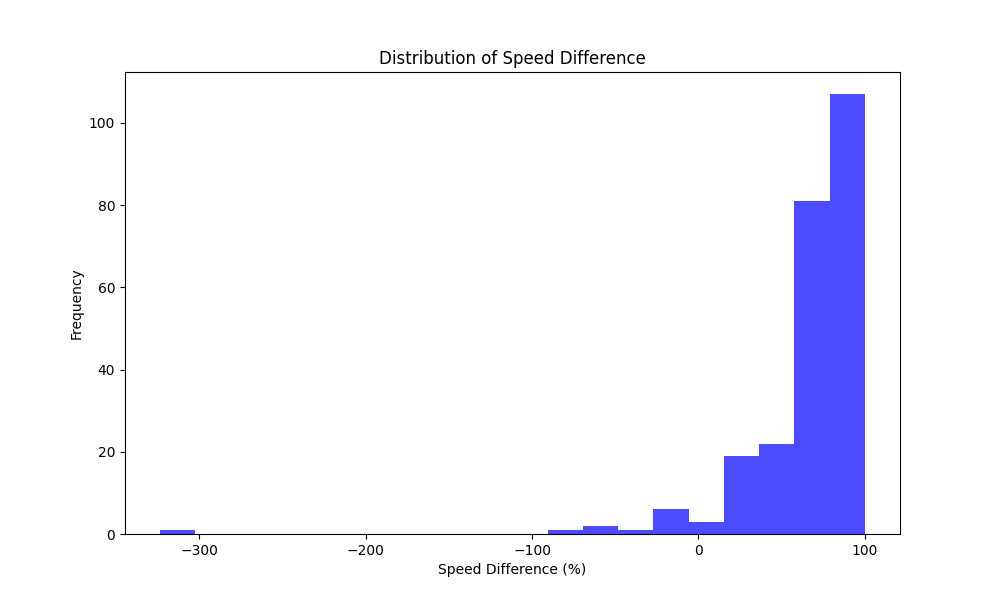
Figure 5. Akamai → S3 vs Imgproxy → S3 speed difference histogram
Conclusion: Akamai pulls Akamai → S3 well past Imgproxy’s standalone ceiling. So the obvious next question: what if we put a CDN in front of Imgproxy too?
Test 3 — Akamai → S3 vs CloudFront → Imgproxy → S3
Goal
Does adding CloudFront in front of Imgproxy close the gap to Akamai-fronted S3?
Hypothesis
A CDN in front of Imgproxy should largely cancel its 2 MB/s ceiling.
Method
- Control: Akamai → S3
- Treatment: CloudFront → Imgproxy → S3
- Three downloads each, averaged.
Results
The CloudFront-fronted Imgproxy path now caps around 8 MB/s on the mean — a 4× lift from the 2 MB/s standalone ceiling. The speed difference histogram has shifted noticeably toward negative values, meaning the treatment (Imgproxy + CloudFront) is now often faster than the control.
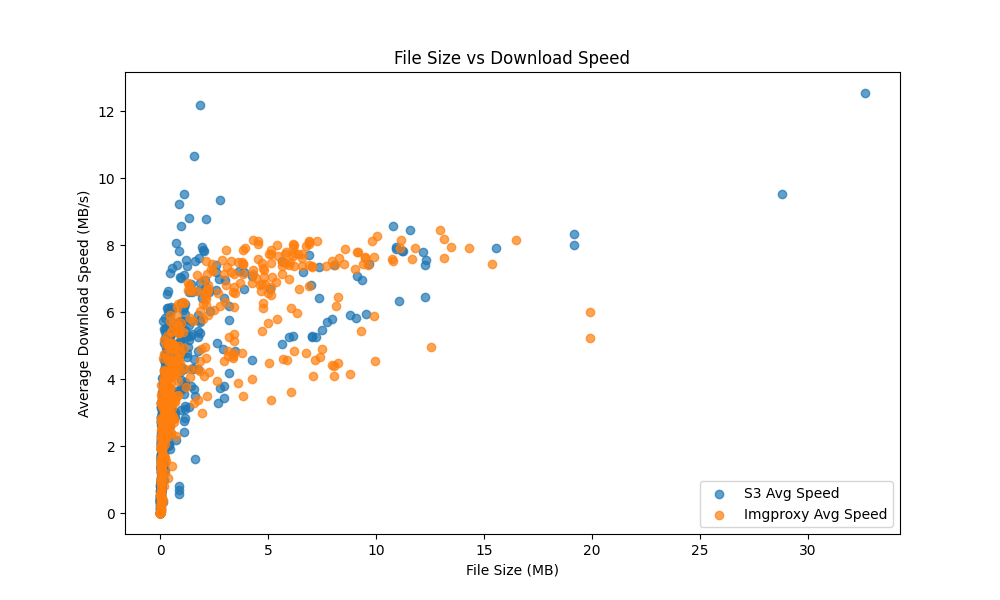
Figure 6. Akamai → S3 vs CloudFront → Imgproxy → S3 download speed scatter
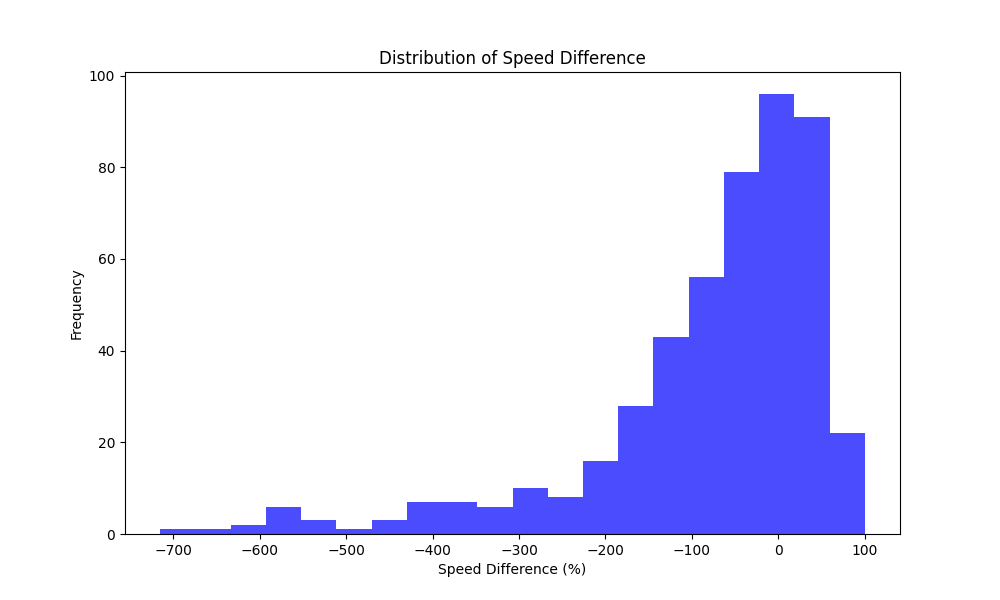
Figure 7. Akamai → S3 vs CloudFront → Imgproxy → S3 speed difference histogram
Conclusion: Significant lift — roughly 2 MB/s → 8 MB/s on the mean. But the means hide a problem: how does a fresh request behave when the cache hasn’t built up yet?
Test 4 — CDN warm-up effect (Wilcoxon signed-rank test)
Goal
Quantify how performance evolves across the 1st, 2nd, and 3rd request to a given object on CloudFront → Imgproxy.
Hypotheses
- H₀: No statistically significant difference between request 1, 2, and 3.
- H₁: A statistically significant difference exists.
Method
- Control sample: 1st request to a given object via CloudFront → Imgproxy.
- Treatment samples: 2nd and 3rd requests to the same object.
- Same object, same path, three back-to-back fetches per object, across a sample of objects.
The throughput samples are paired (same object) and not normally distributed (clear skew, with a long tail toward zero on cold-cache hits). That rules out the paired t-test. I used the Wilcoxon signed-rank test — the standard non-parametric alternative for paired data — which compares the ranks of the within-pair differences instead of their raw values.
Results
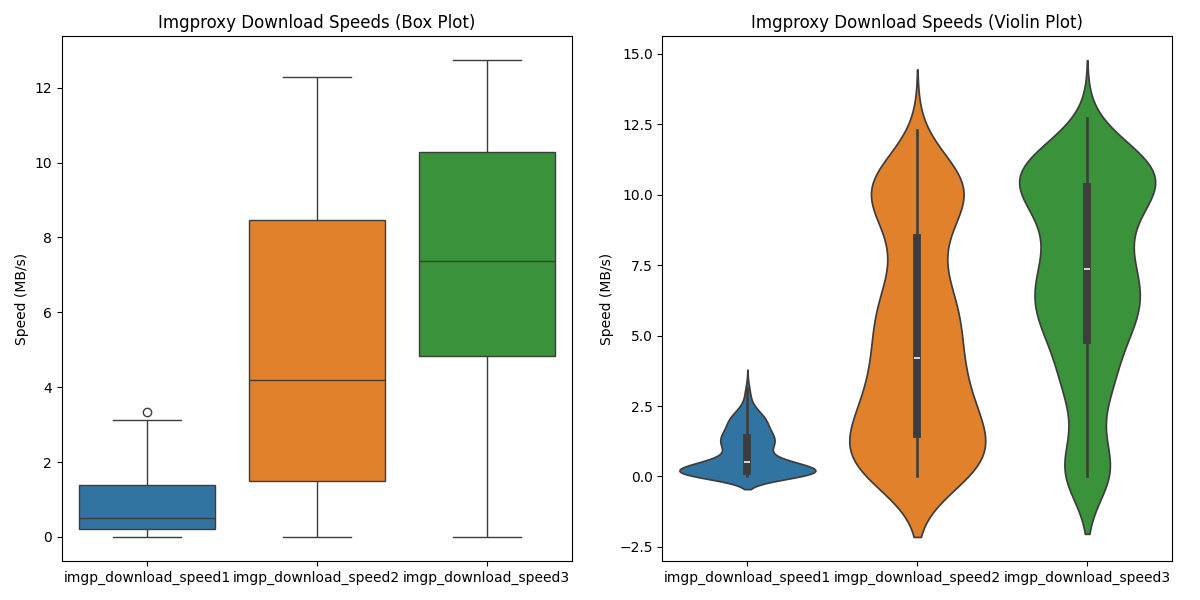
Figure 8. Box + violin plot — request 1 vs 2 vs 3 (CloudFront → Imgproxy)
a. Speed₁ vs Speed₂ (CloudFront → Imgproxy)
- W = 159.0, p = 6.52 × 10⁻⁸² (p ≪ 0.05, highly significant)
- Interpretation: the 2nd request is significantly faster than the 1st.
b. Speed₁ vs Speed₃ (CloudFront → Imgproxy)
- W = 38.0, p = 3.09 × 10⁻⁸³ (p ≪ 0.05, highly significant)
- Interpretation: the 3rd request is significantly faster than the 1st.
What the warm-up looks like
- 1st download (
imgp_download_speed1): median ~0.5–1.0 MB/s — basically the standalone-Imgproxy ceiling. CDN has nothing to serve, so it forwards through Imgproxy’s bottleneck. - 2nd download (
imgp_download_speed2): median ~4.0–4.5 MB/s. Distribution shifts up; the cache is partially populated. - 3rd download (
imgp_download_speed3): median ~7.0–7.5 MB/s, distribution tightens around the higher band. Cache is fully populated; CloudFront serves directly.
The CDN’s effect is gradient, not binary. First view of an object pays the bottleneck price; subsequent views see the full benefit.
Bonus Analysis
Does standalone Imgproxy also speed up across repeated requests?
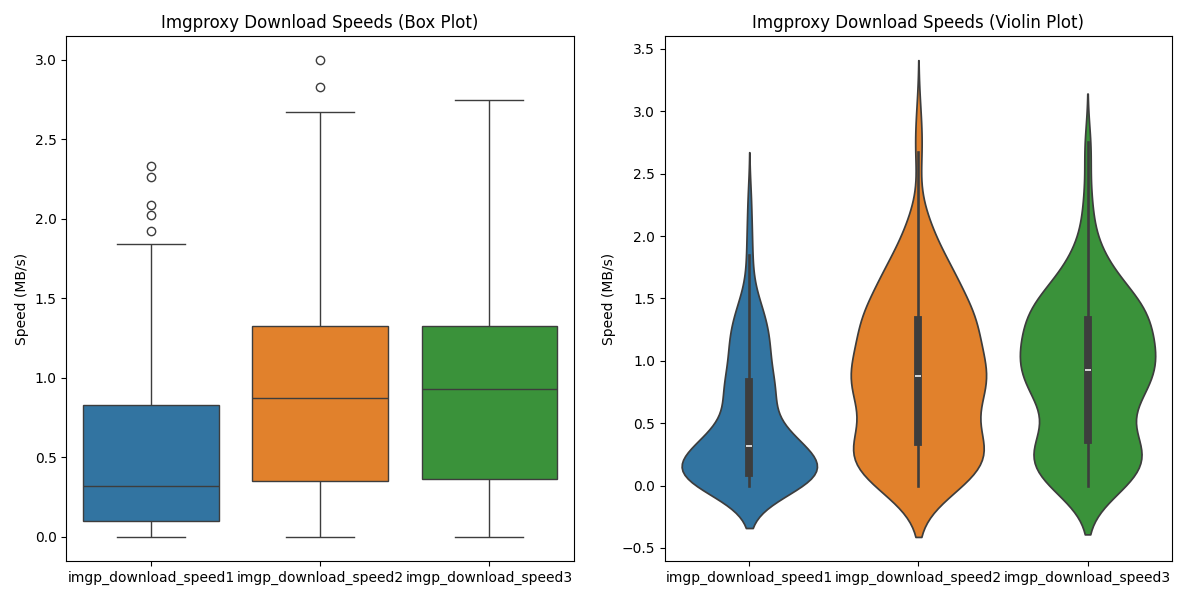
Figure 9. Box + violin plot — request 1 vs 2 vs 3 (Imgproxy without CDN)
Yes. Three back-to-back fetches against bare Imgproxy (no CDN) show a difference between request 1 and request 2 — but 2 and 3 look essentially identical. Suggests Imgproxy itself caches the transformed output internally. Worth confirming in the docs (TODO).
Quantifying the cold-cache penalty
Method
- Control: CDN → S3, three downloads averaged
- Treatment: CDN → Imgproxy → S3, first download only
If the blue points sit on the red identity line, the two paths are equally fast for that object.
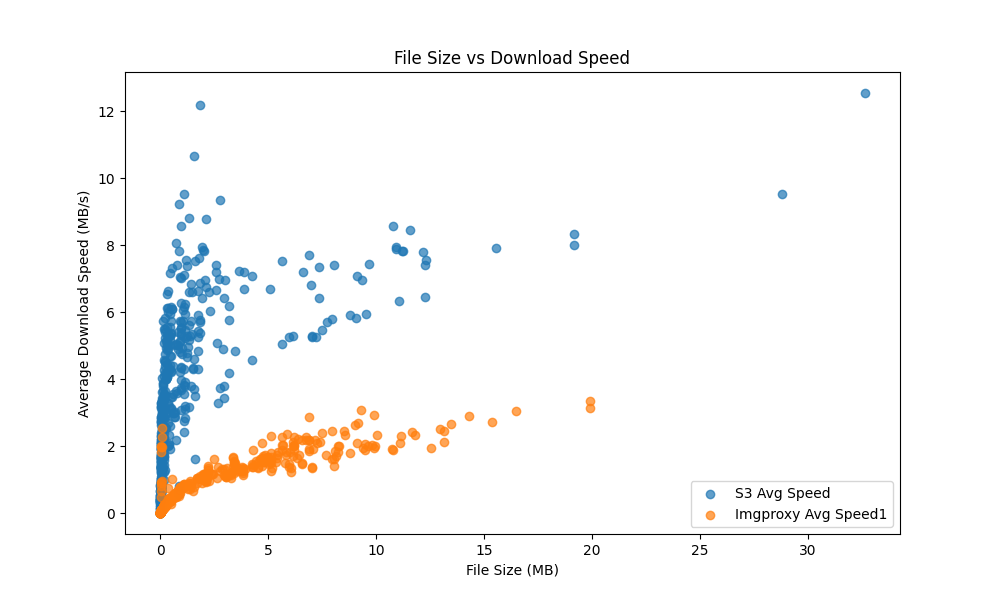
Figure 10. CDN → S3 (3-run avg) vs CDN → Imgproxy → S3 (1st download) — scatter
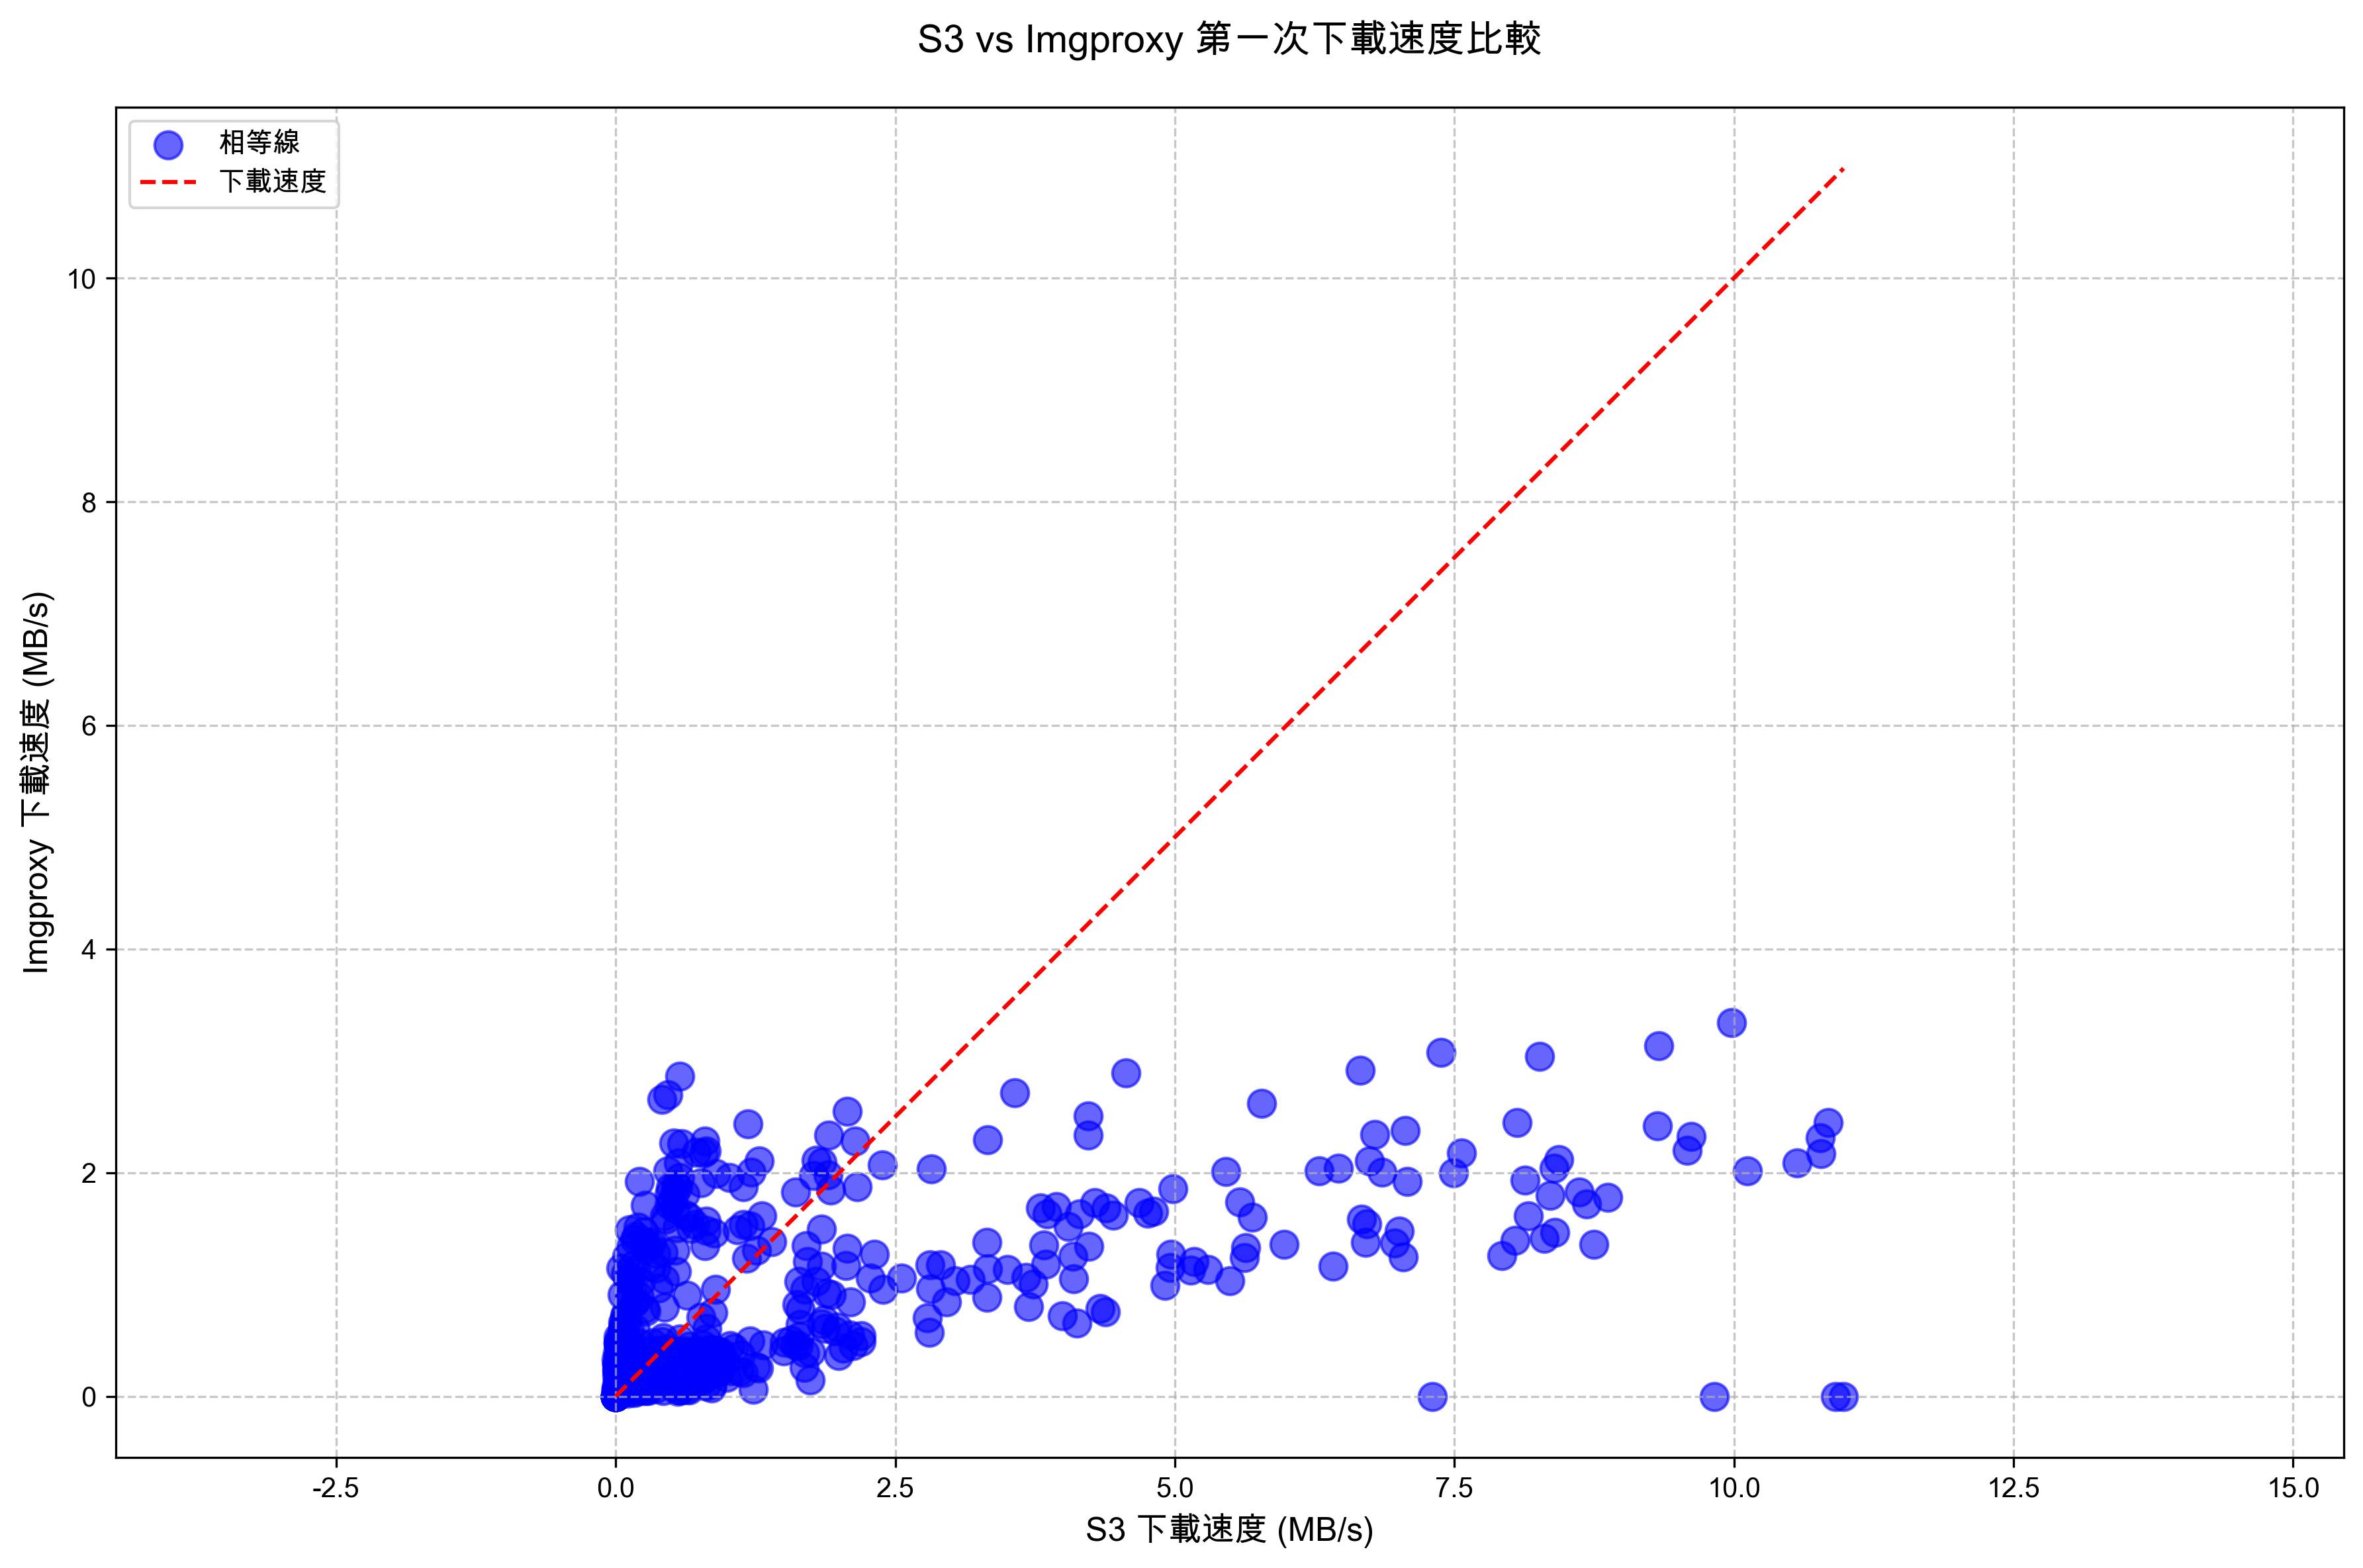
Figure 11. CDN → S3 vs CDN → Imgproxy → S3 first-download identity comparison
Result: the first request through CDN → Imgproxy collapses right back to ~2 MB/s — the original standalone-Imgproxy ceiling. The CDN cannot help until it has something to cache.
After warm-up, the picture flips
Method
- Control: CDN → S3, three downloads averaged
- Treatment: CDN → Imgproxy → S3, average of requests 2 and 3 (warm cache)
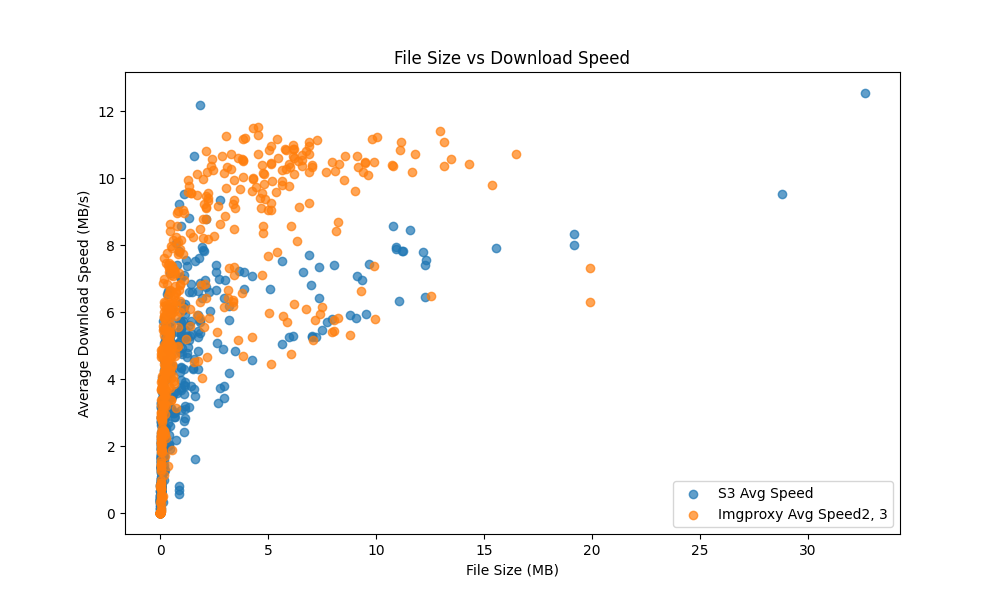
Figure 12. CDN → S3 (3-run avg) vs CDN → Imgproxy → S3 (avg of runs 2 & 3)
Once the CloudFront cache is warm, CDN → Imgproxy → S3 matches or slightly beats Akamai → S3 on throughput. The image-transformation cost gets amortized into the first request, and warm requests pay only the CDN egress.
Statistical bottom line
- The Wilcoxon test confirms the warm-up effect is statistically significant — not measurement noise.
- The 1st → 2nd → 3rd progression is monotonic across the sample.
- CloudFront cache buildup is a real, measurable, decision-relevant phenomenon for this architecture.
Conclusions
- Imgproxy without a CDN is a throughput bottleneck. ~2 MB/s ceiling, max 2.65 MB/s in this environment. Don’t deploy it bare in front of large or hot assets.
- Imgproxy with CloudFront in front matches or beats Akamai → S3 — but only once the cache is warm. A cold request still gets the bare-Imgproxy throughput.
- CDN → S3 (no Imgproxy) is the simplest and most consistent option for raw throughput, but doesn’t give you on-the-fly compression — which was the whole point.
If image compression is non-negotiable for the UX problem (which it was for me), then CDN → Imgproxy → S3 is the right architecture, but you have to plan for the cold-cache tax. Strategies that follow:
- Pre-warm hot paths (carousel covers, landing-page heroes) via synthetic GETs at deploy time.
- Treat first-view latency as a separate metric from average-view latency — they have different distributions.
- Skip the proxy entirely for the smallest assets where compression buys very little.
What’s next
Akamai also supports image transformation natively. So a fair follow-up: CloudFront → S3 vs CloudFront → Imgproxy → S3 vs Akamai (with image transforms) → S3, on the same network and the same files. Whether the operational simplicity of Akamai’s native transforms outweighs the architectural flexibility of an in-house Imgproxy fleet is its own decision — but I want the throughput numbers before I argue it.